Our Favorite Data Visualizations for the Week - Nov 13
New data on housing sales and mortgage buy downs. Here are the best real estate visuals from amazing creators.
Our favorite data visualizations for the week - Nov 13.
This week we got new data on housing sales and mortgage buy downs. Here are the best real estate visuals from amazing creators. Thank you to all the creators.
The always data-driven Mike Simonsen at Altos brings the goods with his latest report on housing sales. We see more new sellers this year than the same week a year ago. This shows some improvement on our supply-constrained market. Also, more immediate sales. Buyers leaned into the new supply, which also implies slight sales volume growth coming.
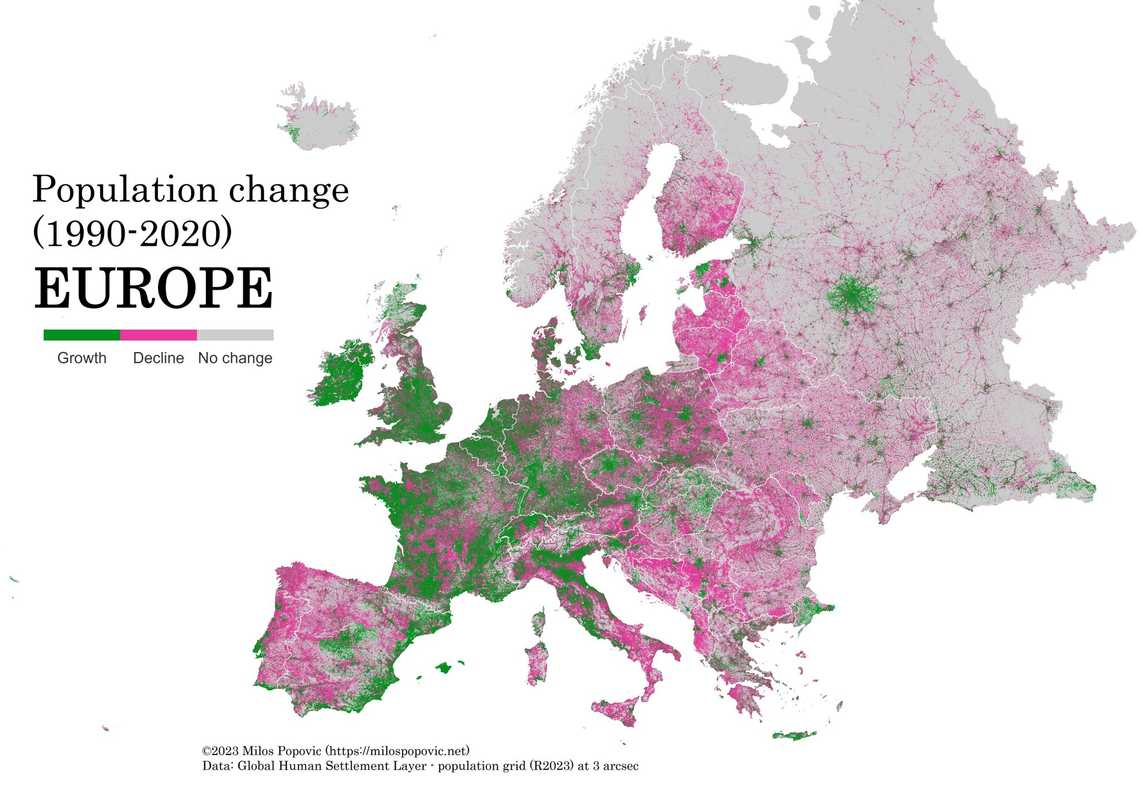
Our good friend Milos shows his R and Python magic. This week he digs into demographics in Europe - showing growth and decline of populations by region.
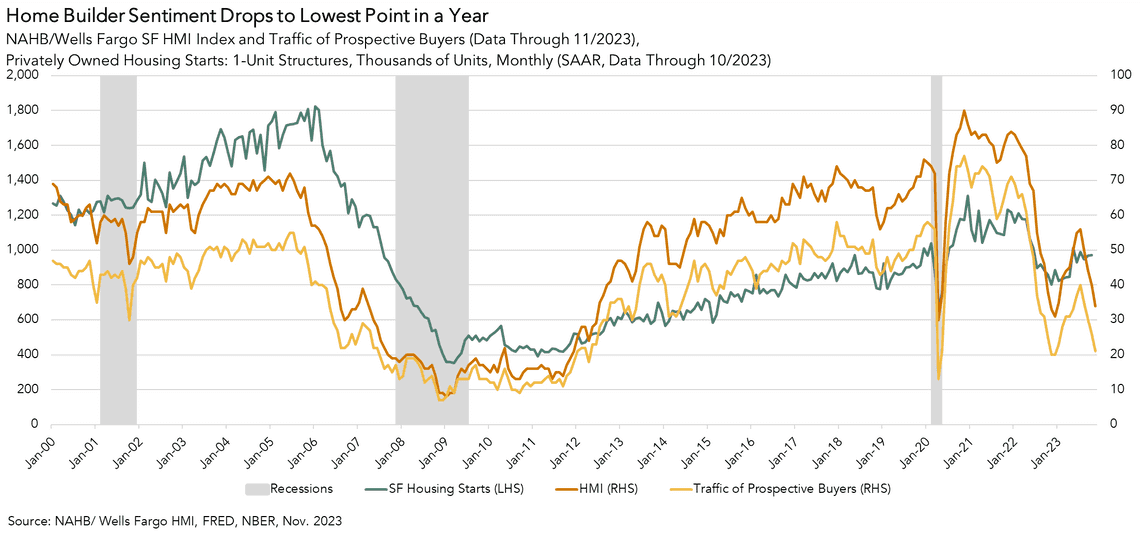
Odenta Kushi shows how housing starts in October were at a seasonally adjusted annual rate of 1.372 million, above the consensus expectations of 1.35 million. This is 1.9% above the revised (down) September estimate of 1.346, and 0.2 % above the October 2022 rate of 968,000.
On the heels of the landmark Asia-Pacific Economic Cooperation summit, the talented @researchremora created a stunning A building height map of San Francisco, California.
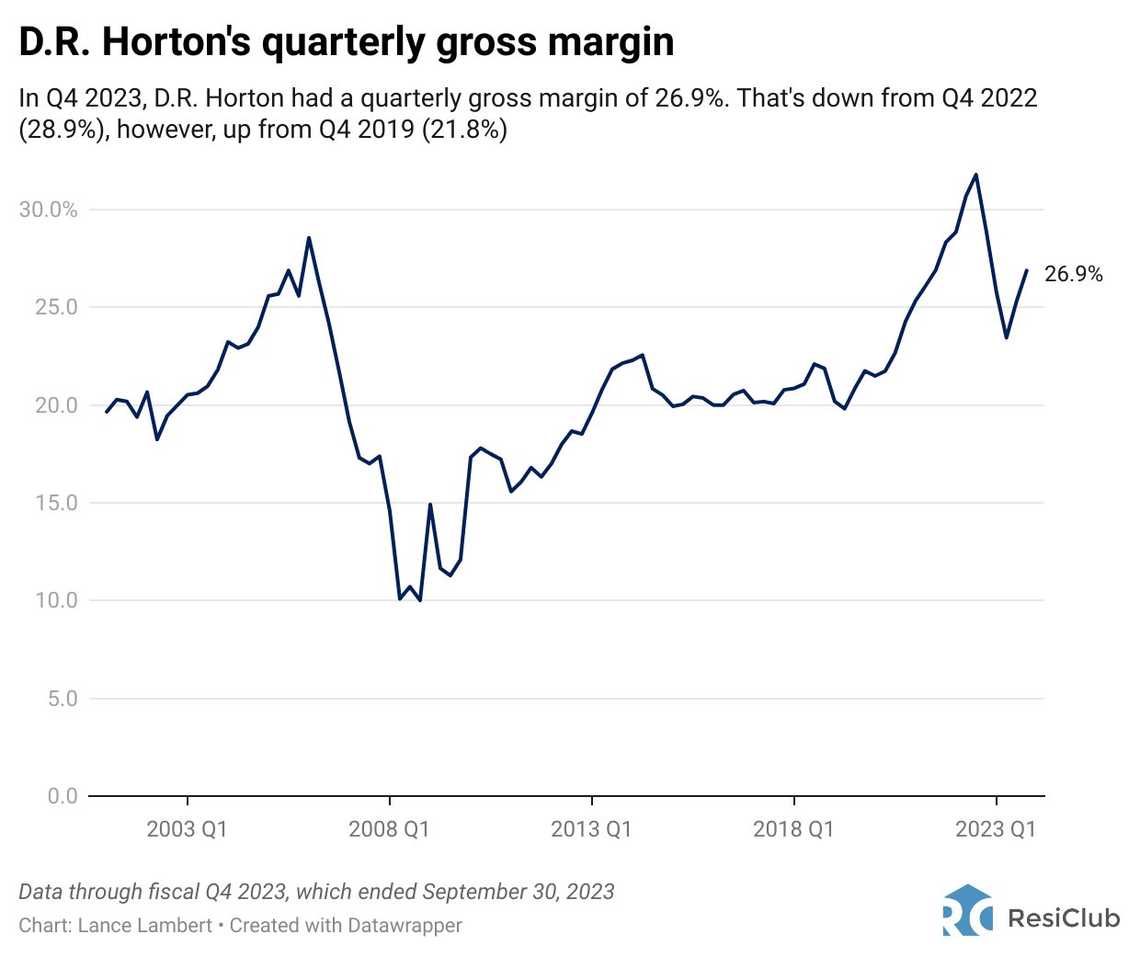
Lance Lambert and his Resiclub team discover answers to one of the most-asked questions in real estate - how are homebuilder able to afford to offer mortgage buy downs to consumers?
The always insightful folks at ParclLabs dig into the St. Louis housing market. A huge institutional buyer is offloading homes at a 20% discount.
- Stew Langille
- @slangille


