Favorite Visualizations In Real Estate - Week of December 18
New data visualizations from talented creators highlighting changes in the real estate market.
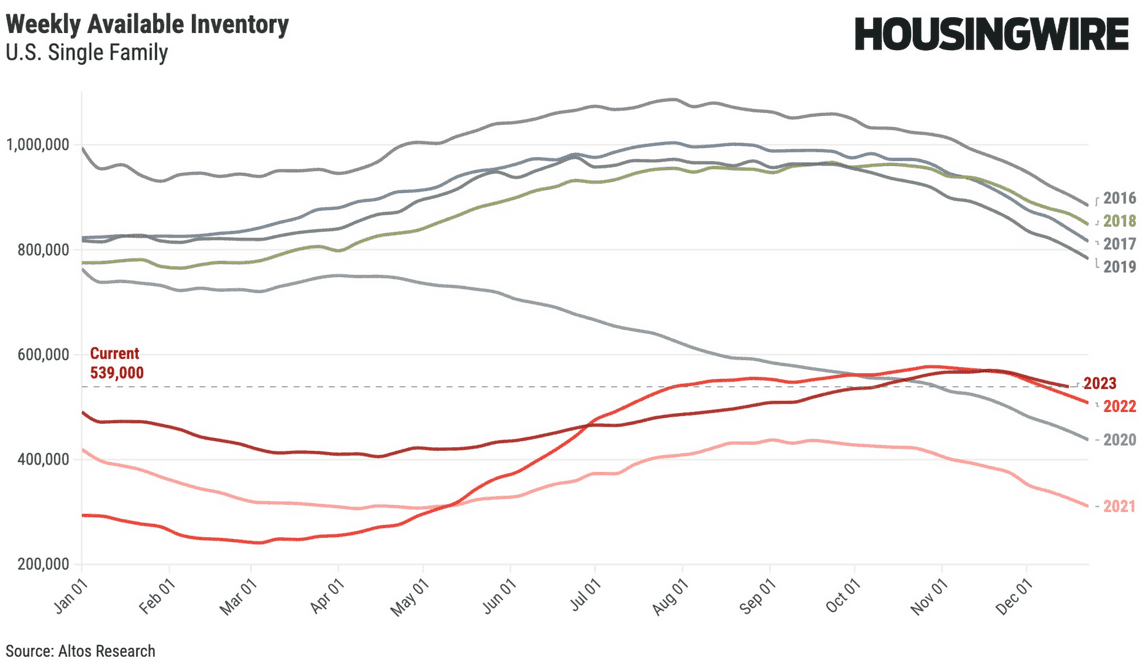
The data driven Mike Simonsen from Altos Research asks: Are home sellers finally coming back to the market? here are now 539,000 single family homes on the market unsold. That’s 3.2% more than last year at this time.
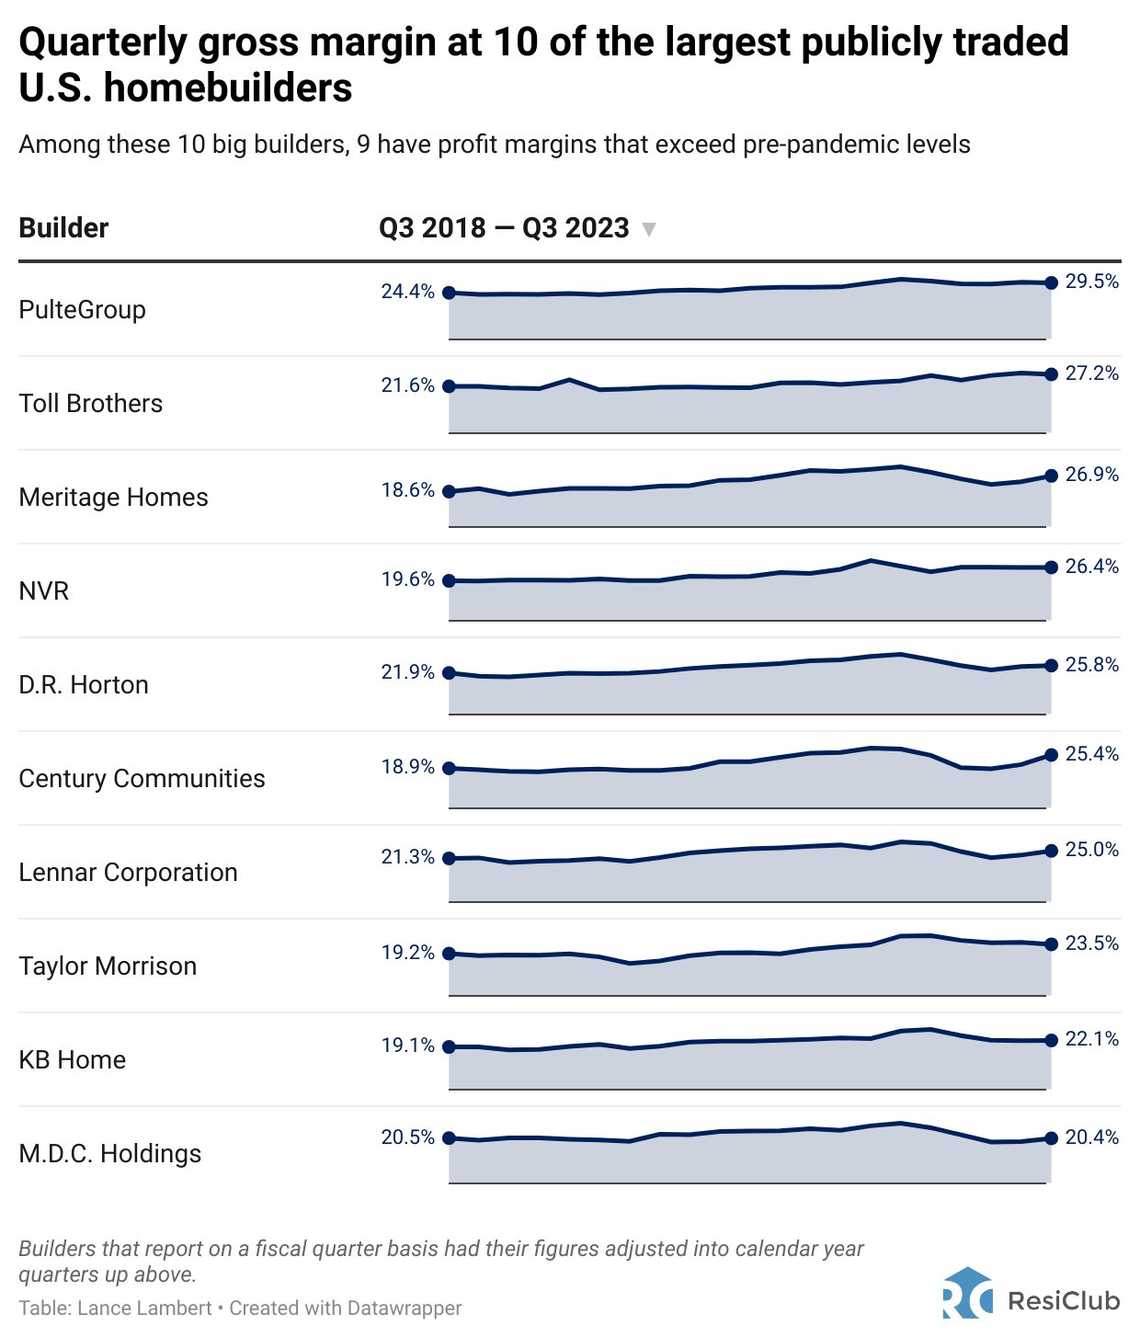
Home builder margins have regained the losses suffered from the pandemic. In several cases the top US home builders now have margins that exceed levels from pre 2019. This points to the overall demand and lack of available inventory in the US national housing market. Thank you to Lance Lambert and Resiclub for the graphic.
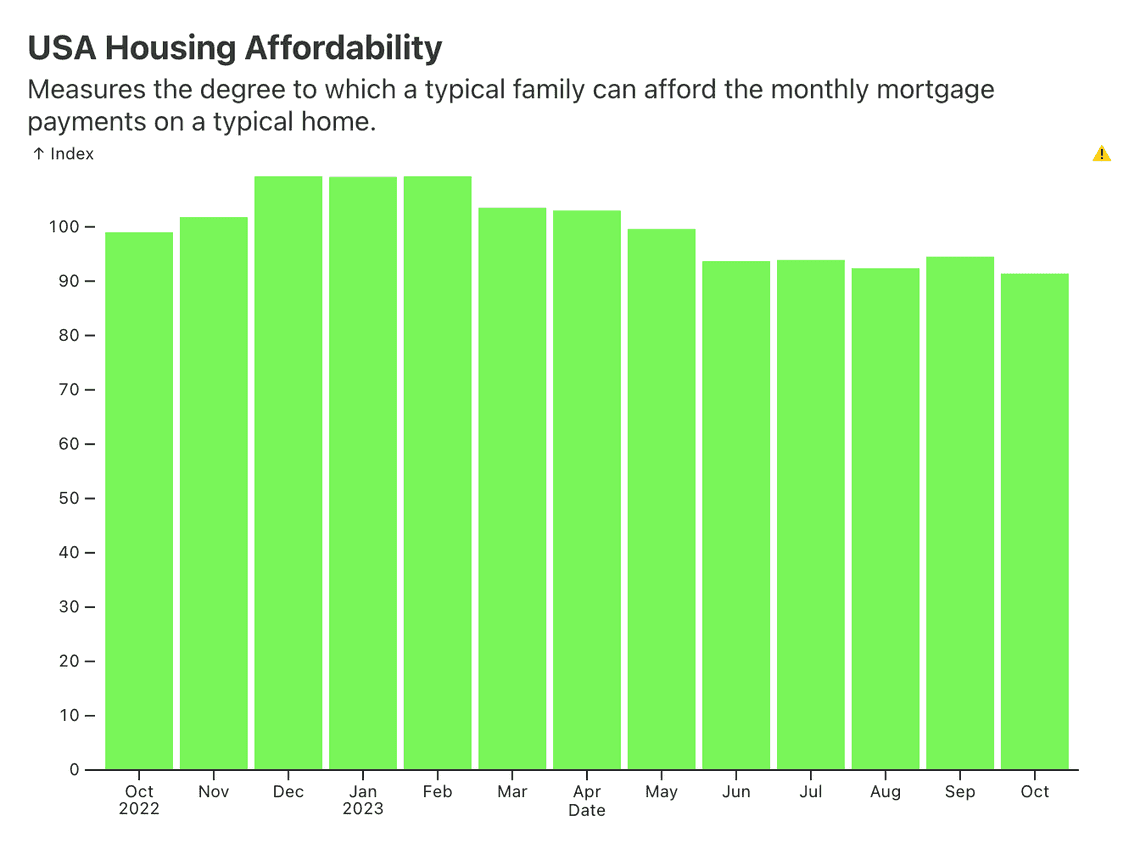
We examined the latest St Louis Fed data on housing affordability. Data from October shows the least affordable housing index in the past year. An index above 100 signifies that family earning the median income has more than enough income to qualify for a mortgage loan on a median-priced home, assuming a 20 percent down payment. This index is calculated for fixed mortgages. If the recent mortgage rates hold steady and continue to drop in December, data for affordable housing could improve into early 2024.
Redfin’s latest payment data points out how new mortgages interest rates are affecting the average monthly payments. Monthly housing payments just hit the lowest level since April.
Research Remora artfully visualizes Earthquakes of California, 1923 to 2023.
- Stew


